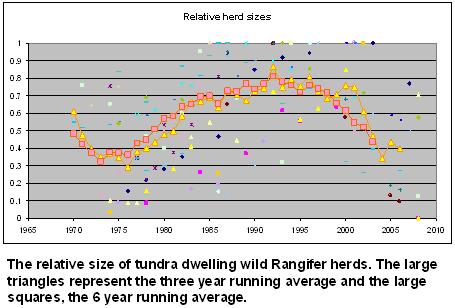
 Caribou numbers typically rise and fall over a timescale of decades but the information to measure trends, especially trends before the 1970s is more qualitative than quantitative. On the mainland, numbers were low from the 1950s to the 1970s when herds began to increase. The increases continued into the 1980s for the mainland herds and the Dolphin and Union herd on Victoria Island. Mainland caribou herds from the western Arctic east to Hudson Bay have declined since their peak abundance in the mid-1980s to mid-1990s (the exact timing depends on the herd). The herds currently in decline are the Porcupine, Cape Bathurst, Bluenose West, Bluenose East, Bathurst, Beverly and probably Qamanirjuaq,-- the exception is the Ahiak the trend for which likely increased between 1986 and 2006 and then possibly stabilized. Since the mid-1980s, the George River herd declined and the Leaf River herd increased until the most recent census in 2001. The figure below shows the herds on one one scale (relative size) between 1965 topresent. The cycle is evident.
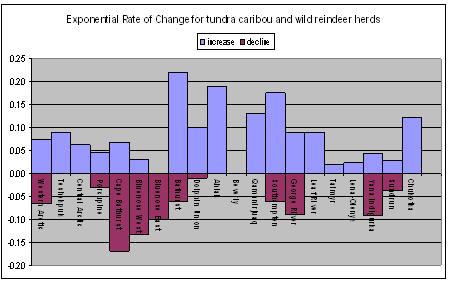 The rates of increase and decrease of individual herds vary dramatically (see figure below). The herd with the greatest rate of increase was the Ahiak (although estimates are poor) while the Bluenose West and Porcupine herds showed the lowest rates of increase among Canadian Herds. During the decline phase, the three herds east of the Mackenzie Delta: the Cape Bathurst, Bluenose West and Bluenose East, had the greatest rate of decline.